
THE MEETING WHERE SOMEONE MENTIONED THE BUSES
It wasn't even a proper project brief. During a meeting with a small EU city that already runs a smart city platform - context broker, some sensors, dashboards that exist - someone mentioned the buses.
The city outsources public transport to an external operator, and the service has some "minor" problems. Buses show up late. Sometimes they don't show up at all. The city complains to the operator. The operator says everything is fine. The city probably has a contract with SLA clauses and penalty mechanisms, but no independent data to back up a single claim. The city gets blamed by citizens, the operator keeps getting paid, and nobody can prove who is right.
This is not a technology problem but a power problem. And the one who has the data wins the argument.
THE DATA WAS ALWAYS THERE (JUST NOBODY CONNECTED IT)
Here is the thing about bus operators - they already track their entire fleet with GPS. Every bus reports its position every 30 seconds. But this data doesn't flow to the city. It flows to Google Maps. The operator pushes it there because that's how passengers find their bus on their phone, and the operator wants to be visible on the platform everyone uses. It is a sales enabler for the operator - more riders, more revenue. The format is called GTFS-Realtime - an open standard by Google that every transit app in the world understands. The operator also maintains GTFS Static data - routes, stops, timetables, trip definitions - because Google Maps needs that too.
So the real-time positions exist. The schedules exist. In open, documented formats. Accessible if you know where to look. Meanwhile the city's context broker sits there with data from other projects - sensors, environmental monitoring, whatever was connected years ago - but the transit data lives in a completely separate world. All the ingredients were sitting on the table. Nobody had combined them.
And to be clear - we didn't get an order from the city to do this. Nobody asked us. This was our own initiative, our way of showing what a FIWAREBox Context DataHub can actually do when pointed at a real problem. Without the transit data connected to their platform, the city simply had no way to answer the question that matters. Not because their IT team failed - they work with what they have - but because nobody had brought these data sources together yet.
We did it because we can.
DAY ONE: FROM GTFS TO NGSI-LD IN HOURS
We decided to see how fast we could build a working proof of concept, using only publicly available data, without telling the city, without asking the operator, without anyone's permission.
As a starting point, we pushed all open datasets from the national data portal into our FIWAREBox Data Catalog - fully automated with our tools, takes almost no time or effort - just to see if there was anything valuable in there for this city.
Then the actual work began. CASSIOPEIA is our open-source data transformation engine - a Rust-based pipeline that takes data from any source format and converts it into NGSI-LD entities following FIWARE Smart Data Models. Think of it as the universal translator between whatever format your data is in and the standardized language your context broker speaks.
First, CASSIOPEIA ingested the GTFS Static data - stops, routes, timetables, and vehicle trip sequences. Within an hour, the entire transit schedule was living in our Scorpio context broker as properly structured NGSI-LD entities. Then the real-time feed.
We didn't get direct access from the operator - that would have required meetings, NDAs, and three months of emails. But the GTFS-Realtime stream was out there, feeding Google Maps, updated every 30 seconds. We found it and pointed CASSIOPEIA at it. Vehicle positions started flowing into the broker - latitude, longitude, bearing, speed, trip ID, route ID, timestamp. Every 30 seconds, every bus in the city. We even got the bus icons for the online maps.
By the end of Day 1, our context broker held every bus position in real-time and every scheduled stop time for every route. One broker. One API. Simple data model. No custom code - just CASSIOPEIA mapping configs and a pipeline.
WE CAN SEE THE BUSES NOW
Before getting into delay algorithms, we needed to see what we had.
We built a simple web application - a route and stop selector on one side, a live map on the other. OpenStreetMap base layer, nothing fancy. All bus lines and stops are available in the tree view. Buses appear on the map at all times, their positions refreshing every 30 seconds as new data flows from the broker. Select a specific line, and the map highlights its route and the buses currently serving it. Select a stop, and you see which buses are approaching. Mouse-over the bus provides some context broker information. Nothing revolutionary about a map with moving bus icons.
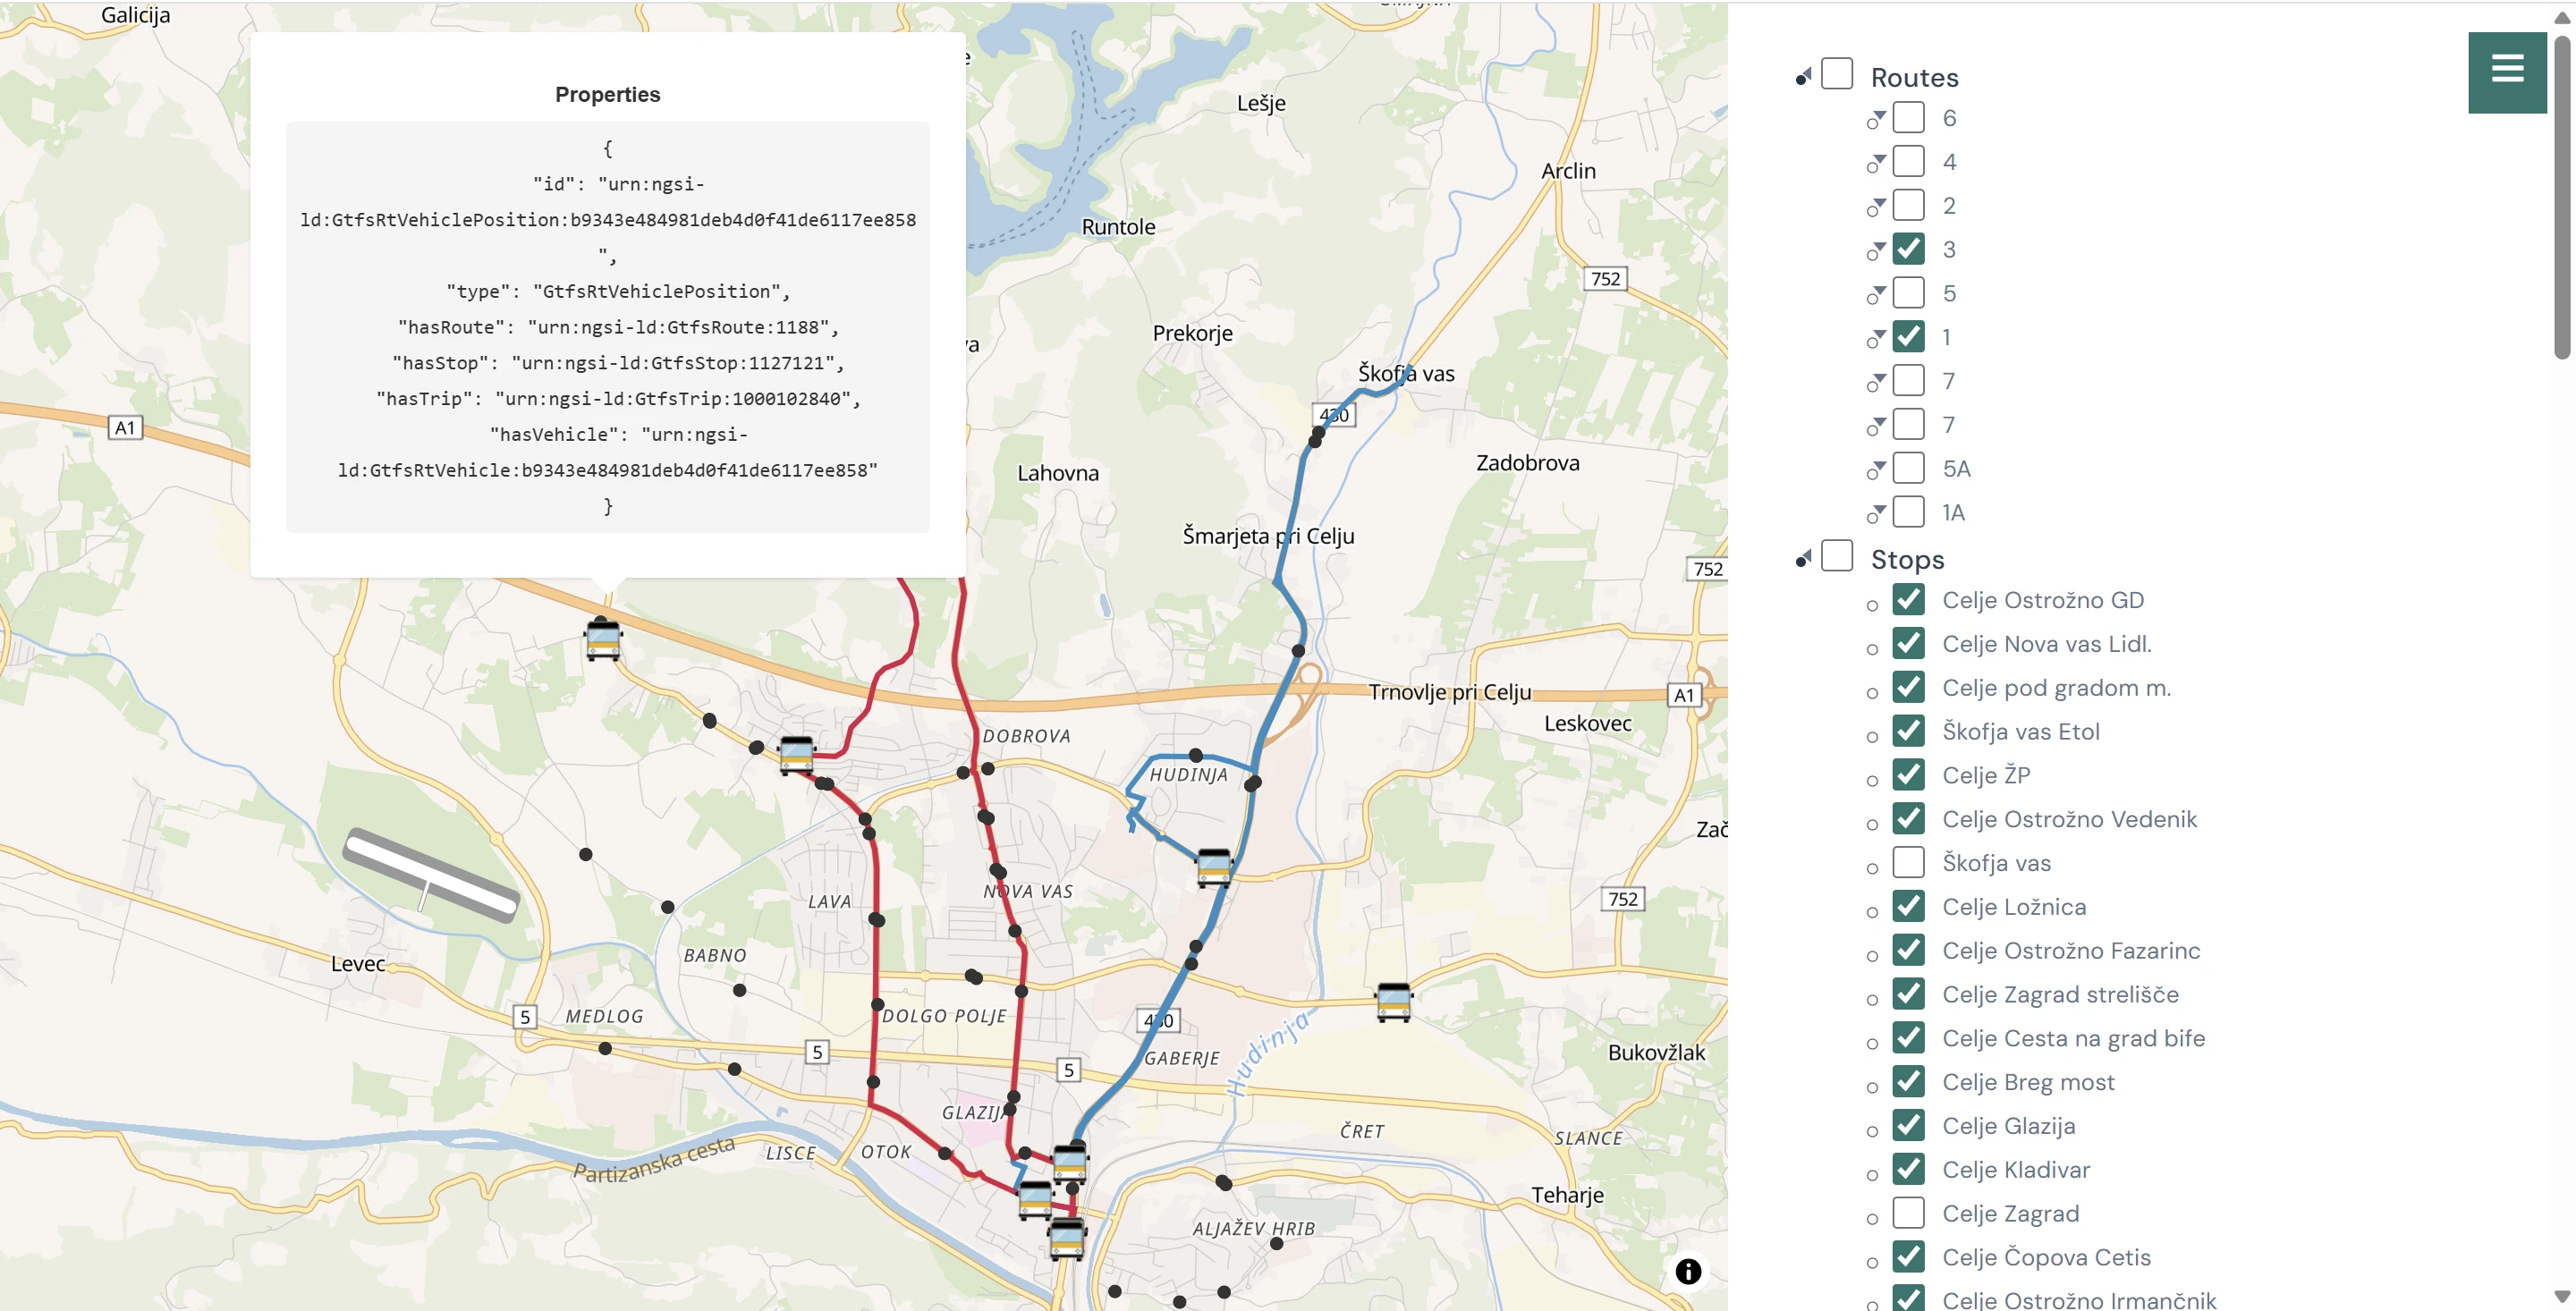
FIWAREBox - a simple real time map
But here is what matters: this entire visualization runs on data from the context broker (NGSI-LD). Not a proprietary feed. Not the operator's custom portal that only they can access. Our own context broker, serving the data through the same interface as every other dataset in a smart city platform - and trivially migratable to the city's own broker when the time comes.
Any developer, any department, any future application can query the same API and get the same data. The bus positions are not locked in someone else's system anymore. And the same platform, the same API, can just as easily serve parking availability, EV charging station status, bike-sharing positions, water meter readings, waste bin fill levels - whatever the city connects next.
Interoperability.
THE 40-METER CIRCLE THAT COULD CHANGE EVERYTHING
We did not implement the delay detection algorithm in these two days - the MVP was about proving the data pipeline and visualization work. But we designed the approach and it is remarkably simple.
Every bus stop has GPS coordinates. Draw a 40-meter circle around each one. When a vehicle's real-time position enters that circle for the stop it is supposed to visit next in its trip sequence, you record the actual arrival time. Compare it to the scheduled arrival time from the GTFS Static data. The difference is your delay. A lightweight process - a Node-RED flow or a Python script - subscribes to vehicle position updates from the broker, runs this geofence check continuously, and publishes delay entities back into the same broker.
The gotchas are predictable: matching a vehicle to the right trip when the operator's feed is sloppy with trip IDs, GPS jitter when a bus is stuck in traffic near a stop and bounces in and out of the geofence, buses that drive through a stop without actually stopping because nobody was waiting, end-of-line turnarounds where the bus sits at the terminus and triggers a false early arrival for the next trip. All solvable with simple state flags and tolerance windows. None of them are hard engineering problems. They are afternoon-of-debugging problems.
We also sketched out the semantic model - how delay data would be structured as NGSI-LD entities with relationships to routes, trips, and stops - so that the delay information is not just a number in a database but a quarriable, connected part of the city's data infrastructure.
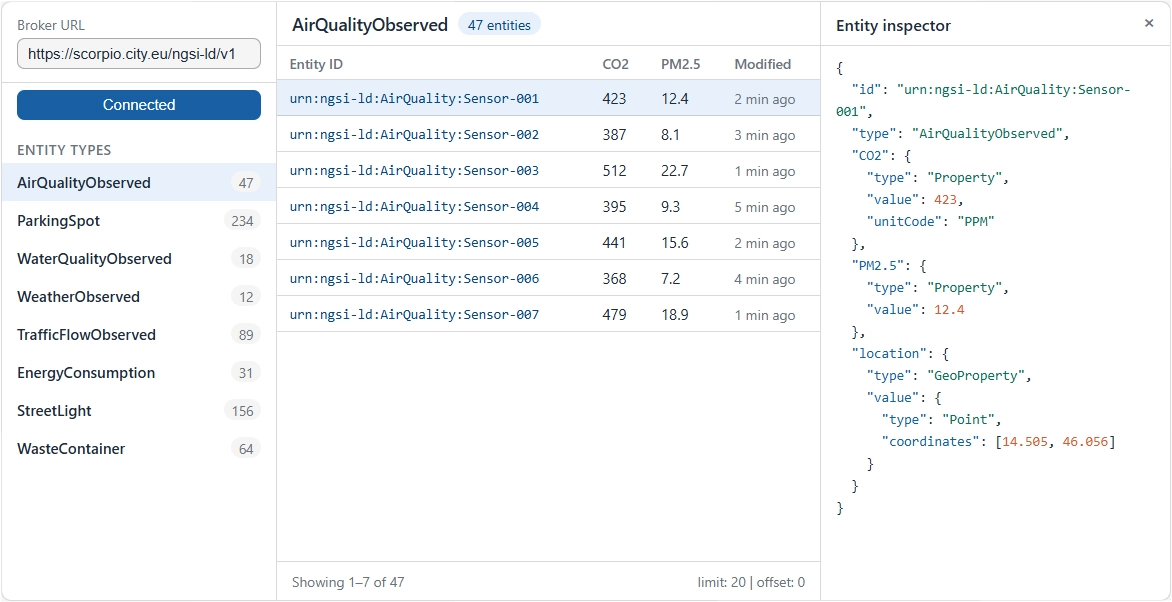
FIWAREBox - Semantic Query builder / visualizer for public transport used in the other project
We didn't implement this in the PoC, but we have built exactly this kind of geofence-based detection in other projects - it works, and the screenshot below shows what the result looks like in practice.
THE MISSED BUS IS THE REAL STORY
Late buses are annoying. Missed buses are contract violations.
The geofence approach would catch both, and the missed bus is the one that actually matters for the city's relationship with its operator. The logic is straightforward: if the scheduled departure time passes and no vehicle enters the stop's geofence within a reasonable tolerance window - say 15 minutes - that trip gets marked as missed. Imagine running this for a week and discovering that a specific route had buses arriving 3-8 minutes late on average - irritating but explainable by traffic - while also having multiple trips where the bus simply never showed up. The operator's own monitoring system would never flag those missed trips, because a bus that was never dispatched doesn't generate a GPS signal. Their system tracks buses that are running. It does not track the absence of buses that should have been running. Nobody measures what didn't happen.
With a Context DataHub that holds both the schedule and the real-time positions, measuring what didn't happen becomes a simple temporal query. That is the kind of capability that turns a conversation between a city and its operator from "you say, we say" into "here is the data."
WHAT WE DIDN'T BUILD (YET) - AND WHAT A SYSTEM INTEGRATOR WOULD CHARGE YOU
Honesty about limitations. In less than two days we built a proof of concept: a data pipeline ingesting real-time and static transit data into a context broker, and a web application that visualizes bus positions on a map with a route and stop selector. The delay algorithm is designed, not deployed. The semantic model is sketched, not implemented.
Because the broker stores temporal data, adding a time slider to the map would let you rewind and see where every bus was at any point in the past - useful for investigating specific incidents or reviewing a full day of operations. Connect a prediction model to the same broker, and the slider works in the other direction too - showing estimated future positions and arrival times.
Add passenger counters on the buses, and suddenly you can correlate occupancy with delays and answer the question nobody is asking yet: do we need more buses on this route, or just a more reliable operator?
Build a mobile app on top of the same NGSI-LD API, integrate it with the city card system, and passengers get real-time arrival information from an independent source - not from the operator who has every incentive to tell them the bus is coming when it isn't. None of these are separate platforms. They are all applications consuming data from the same broker through the same API.
What would be needed to move from PoC to production: proper alerting with escalation chains so the transport desk gets notified when delays pile up or trips go missing - we are building a tool called AQUILA for exactly this, it is in active development but not published yet.
A data operations browser where the transport team can click through routes, inspect individual trips, and review temporal history - our tool TELESCOPIUM handles this, also in active development.
FIWAREBox - Telescopium - Entity inspector
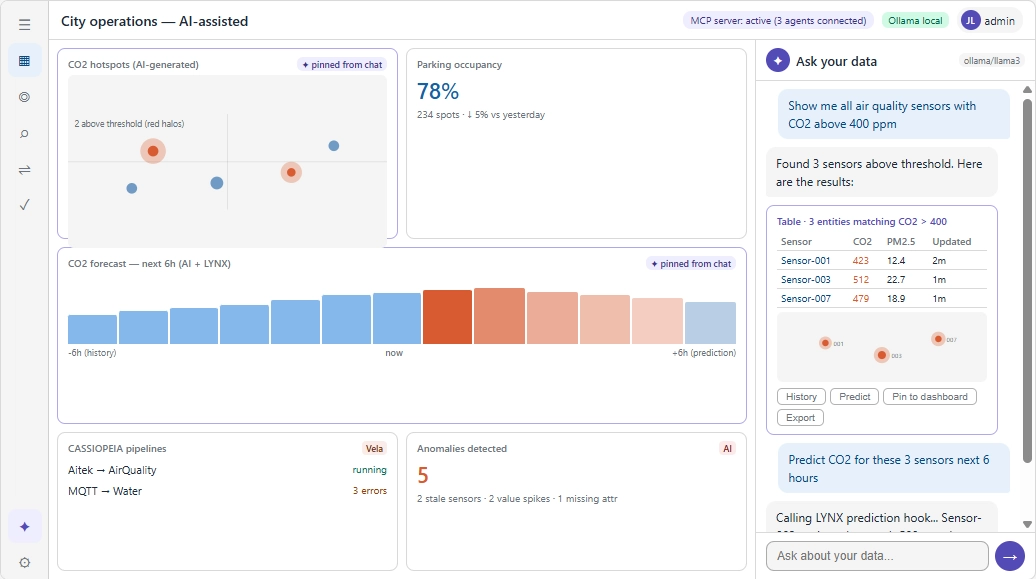
FIWAREBox - Telescopium - Dashboard
Compliance reporting that auto-generates SLA breach evidence for contract managers - that would be NORMA, same status. Access control so the bus operator can see their own performance data but not the city's internal analysis - LIBRA, our NGSI-LD API gateway, is already built and production-ready, we just didn't deploy it in this quick PoC.
Now, the comparison nobody asked for. A system integrator would sell this as a smart mobility project: €80K-150K for the core system, 6-9 months delivery, proprietary APIs, and an annual support contract of €15K-25K. We showed the core of it working in less than two days, on a universal platform that costs at least 10 times less and is not a single-purpose bus tracker - it is a Context DataHub that serves every use case the city will ever throw at it.
THE PLATFORM THAT WORKS FOR THE NEXT PROBLEM TOO
The point of a Context DataHub is not that it solves the bus problem. The point is that after solving the bus problem, the same platform solves the next one without starting from zero. The bus data can live in the same broker next to air quality data, parking data, building energy data - all quarriable through one NGSI-LD API.
When the mayor asks next month "can we also see where the waste collection trucks are?" the answer is the same platform, the same CASSIOPEIA, a different mapping config, and roughly a week for a production-ready deployment - or a couple of days for another MVP like this one.
When the water utility wants to connect their smart meters, same answer. And here is the part that matters most: the city does not need to use our web application.
The data is the product, not the dashboard. Once the data sits in the broker as standardized NGSI-LD entities, anyone can build on top of it. The city's own developers, a local startup, another vendor, a university research team - they all query the same API and get structured, semantically consistent data. The web app we built in two days is a teaser, a proof that the data works. The real value is that anyone can replace it, extend it, or build something entirely different on the same foundation.
When the regional authority eventually says "we want to share anonymized transport data with the neighboring city" - that's where data spaces come in. But that is a topic for another blog post.
The platform doesn't care what data you put into it. It cares that you put it in the same language. Everything after that is just queries - and applications that anyone can build.
DEAR SYSTEM INTEGRATOR, WE NEED TO TALK
Dear system integrator: we know you have beautiful slides about digital transformation. We know somewhere around slide 7 there is a stock photo of a happy family stepping onto a clean bus. We know slide 12 shows your proprietary "smart mobility module" and a price that requires budget approval from two levels above the person in the room.
Here is what cities actually need: connect their existing data sources to their existing broker. Give them a way to independently measure what their contractors promise to deliver. Make it so that the next vendor they hire - waste, water, energy, parking - plugs into the same platform instead of building yet another silo with yet another proprietary API. Make it cost less than the penalty clause in one bus operator's contract.
That is not a platform sale. That is a service. And if you cannot demonstrate the core of it working in two days as a proof of concept, maybe it is time to update the slides.
CONCLUSION
On a technical maturity scale, we're about 30-40% of the way there. We have the basics: CASSIOPEIA ingesting data, Scorpio managing schedules and live positions, and a working map app. What's still missing: deployed delay predictions, advanced analytics, and cross-city data sharing.
For what this city actually needs today - given that they are still at the stage where the bus operator says "everything is fine" and nobody has the data to disagree - we can realistically cover something like 80 to 85 percent of their real, immediate need. Which is not a predictive model or a mobile app or a city card integration. It is the ability to see what is happening and have the data to ask uncomfortable questions.
This is a polite way of saying that a two-day proof of concept on a universal platform already delivers more operational value than whatever the operator's proprietary portal has been showing them for years, and that is a very comfortable place to build from.
In my slightly modified Pareto principle for this case, it simply means that with roughly 30 percent of the full smart mobility stack we already solve well over 80 percent of the problem that actually hurts them today - which is not technology, but the absence of independent, queryable, standardized data.
FUTURE STEPS
Now that the data pipeline is proven and CASSIOPEIA handles the GTFS-to-NGSI-LD transformation, the next logical step is the delay detection algorithm - the 40-meter geofence approach described earlier in this post. A lightweight process that subscribes to vehicle positions, compares them against scheduled stop times, and publishes delay entities back into the broker. Once that runs for a week, the city has something they never had before: an independent, temporal record of what actually happened on every route, at every stop, on every trip.
After that comes the part where it gets interesting for the city's contract management. AQUILA, our alerting and event governance tool currently in active development, would handle escalation chains - notify the transport desk when delays pile up, alert the contract manager when trips go missing, and log everything as auditable evidence.
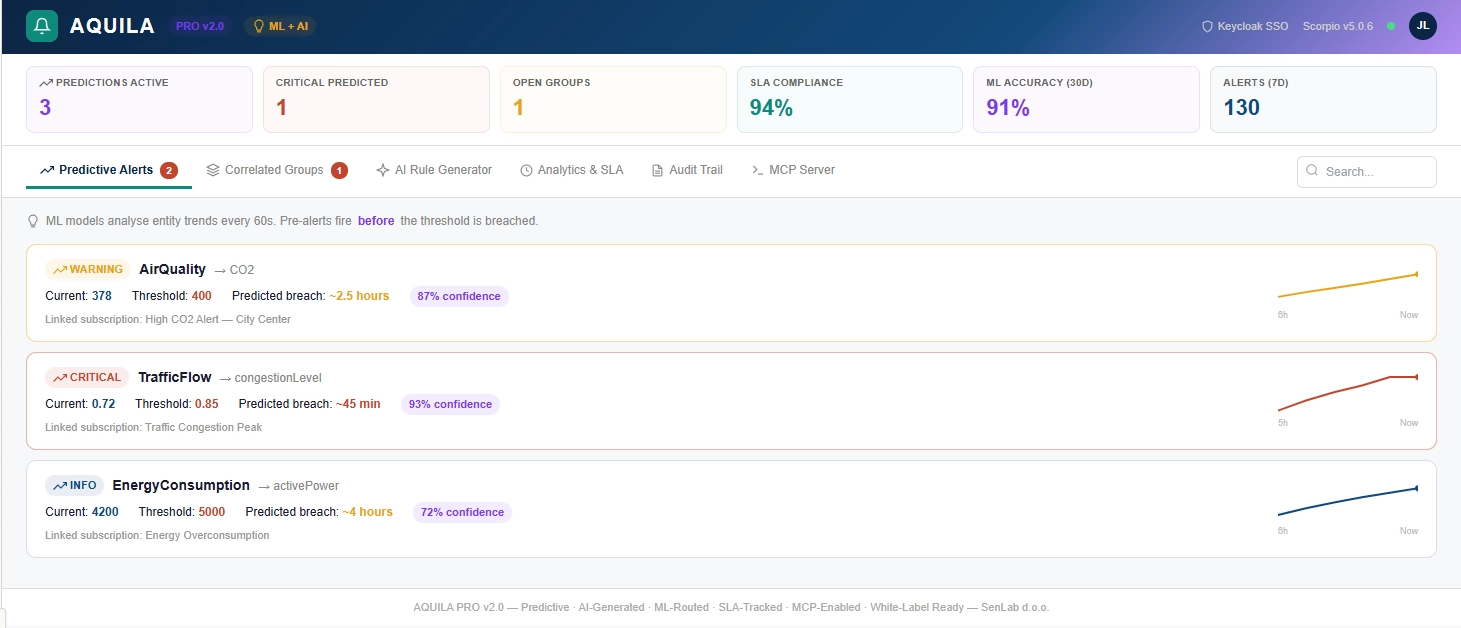
FIWAREBox - Aquila Alerts
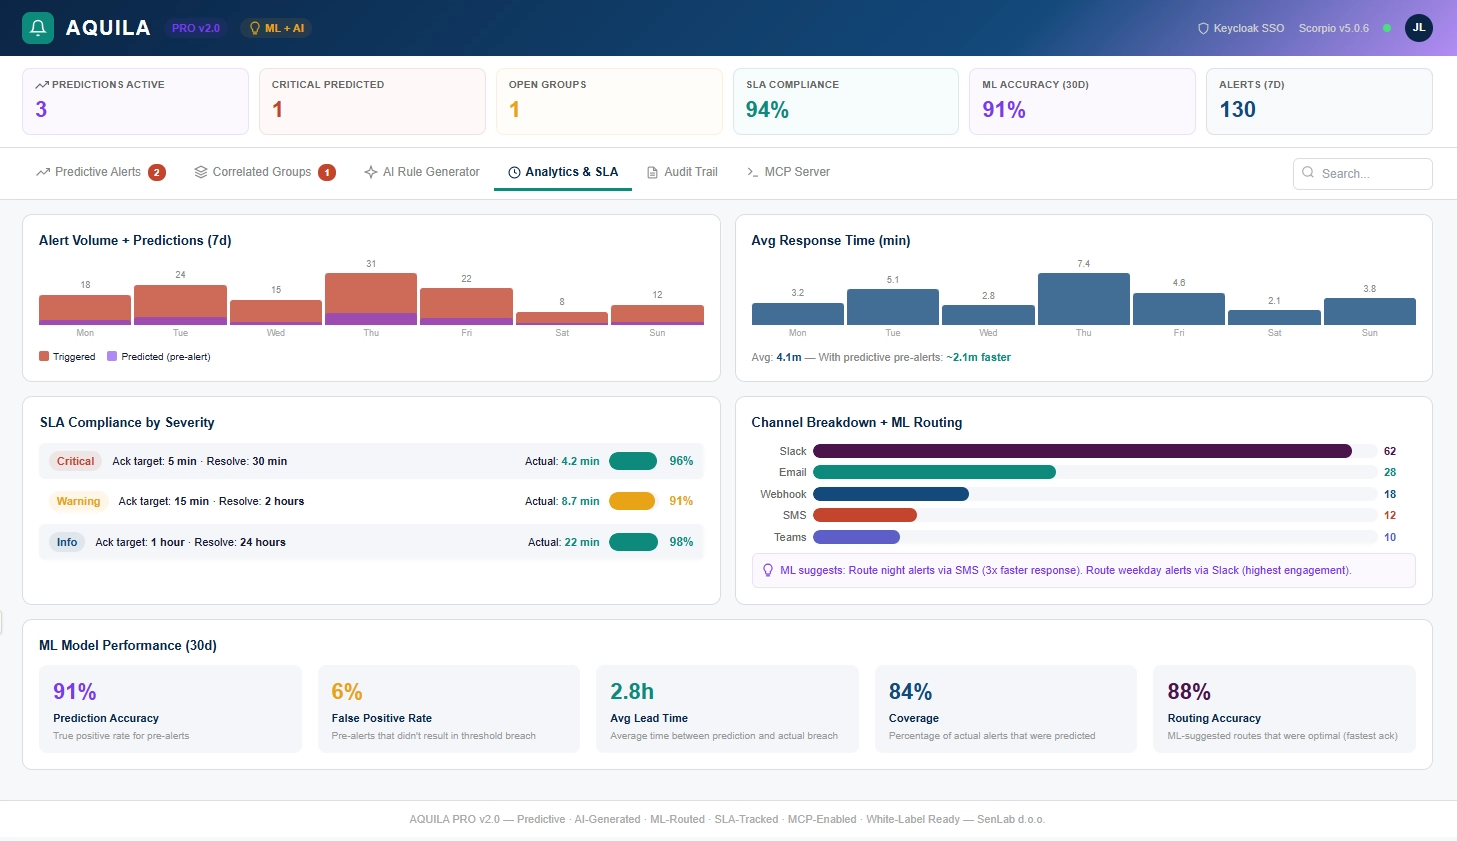
FIWAREBox - Aquila - Dashboard
NORMA, our compliance reporting tool, would turn that evidence into SLA breach reports that the city can actually put on the table during contract reviews. LIBRA, already built and production-ready, would control who sees what - the operator gets access to their own performance data through the same API, but not to the city's internal analysis or penalty calculations.
And then there is the part that has nothing to do with buses. The same broker, the same CASSIOPEIA, the same platform - pointed at waste collection trucks next month, water meters the month after, EV charging stations when the budget allows, bike-sharing when someone asks. Each new data source is a mapping config and a pipeline, not a new project. Each one makes the platform more valuable than the last, because cross-domain queries start answering questions that no single-purpose system ever could.
Just like with our previous work on data catalogs and NGSI-LD mapping, this bus PoC follows the same rule under FIWAREBox:
INVEST 20%, GAIN 80%.
Invest roughly 20 percent of what a system integrator would charge for a full smart mobility platform, and solve well over 80 percent of the real problem - which was never about dashboards or mobile apps, but about having the data to hold a contractor accountable.
Sometimes the biggest step towards smarter public transport is not a grand new platform, but a GTFS feed, a context broker, and someone willing to connect them over a weekend.
DISAGREE, COMMENT, OR WISH TO KNOW MORE?

SMART METERING WORKS. SO WHY DOES IT STILL FEEL… ISOLATED?