
WHY A CITY ALONE IS NOT ENOUGH ANYMORE
There was a time when smart city projects were mostly internal affairs. Cities built their open data portals, opened a few datasets, launched a bike sharing app, maybe a parking website, and declared themselves digital pioneers. But today boundaries matter far less. People move across regions, commuters cross borders every morning, businesses operate on multiple territories, and mobility patterns routinely spill over municipal borders.
A city that tries to digitalise itself in isolation is essentially building a local WiFi network and hoping it will magically cover the entire neighborhood. Data that stops at administrative lines simply does not reflect real life anymore. When mobility, logistics, energy, tourism, or environmental systems connect across cities, the data has to follow.
This is the central argument: a smart city alone is no longer enough. A smart region, a smart corridor, or a cross-city Data Space is where the actual value emerges.
Welcome back to our Data Space series. If you missed the previous chapters, including the one where CKAN behaved nicely or that other one where we extended the CKAN search capabilities, you can find them all here. This chapter builds on those lessons and moves us into real geography: two nearby cities and one shared challenge.

To illustrate our point, we picked Vienna and Bratislava. Two capitals separated by less than an hour of driving, two cultures, two data portals, two administrative systems, and two rather different approaches to open data. And yet, their mobility ecosystems overlap, their commuters cross borders daily, and their transport systems increasingly depend on each other.
For our readers from the USA, you can easily imagine Seattle and Bellevue.
This is the perfect setup for a story about why cities need various connectors, Open data, sensors and data streams, and Data Space. But they can start somewhere, like with a common Data Catalog.
WHY STANDARDIZED DATA HAS BECOME ESSENTIAL
Every city publishes data, but publishing data and publishing usable data are two completely different things. Without shared structures and agreed semantics, every dataset becomes a small archaeological dig. One CSV here, another JSON there, a custom API somewhere else, and a PDF that guessed its way into the directory.
Standardization solves this problem. Once cities agree on formats, schemas, vocabularies, identifiers, timestamps, and metadata rules, their data becomes interoperable by design. Instead of spending weeks writing custom parsers, developers can focus on actual services. Instead of trying to understand what each column means, analysts can compare or merge datasets instantly. Instead of manual cleaning, applications can rely on automated pipelines.
Standards provide the common ground on which cross-city mobility, logistics, environmental monitoring, and energy analysis become possible. Without standards, everything is reinvented repeatedly; with standards, everything becomes shareable.
VIENNA, BRATISLAVA AND THE TWO DIFFERENT DATA PORTALS
For the IndustryMeetsMakers event, we wanted to demonstrate a cross-border mobility use case. The simplest path was to take real datasets from Vienna and Bratislava and combine them in FIWAREBox. Bratislava gave us no trouble. Its portal runs on CKAN, and connecting to CKAN is something FIWAREBoxc DCaaS already handles seamlessly. Integrating Bratislava felt almost too easy.
Vienna, however, uses a different platform called Piveau. That required us to approach the problem differently.
Piveau is a European, open source, large-scale metadata and dataset infrastructure originally developed for national open data portals. Unlike CKAN, which started as a straightforward data catalogue, Piveau was designed from the beginning for DCAT-AP compliance, multi-terabyte handling, and the needs of countries operating thousands of datasets. It powers or supports parts of Austria’s national open data ecosystem, Germany’s data infrastructure, and several EU-level and domain-specific data portals.
Once we understood Piveau’s model, we built a connector for it inside DCaaS. With that, FIWAREBox gained access not only to Vienna but to every Piveau-powered portal. Austria, parts of Germany, several ministries, and various EU-supported portals are suddenly part of our Data Space pipeline. Two cities became an entire region.
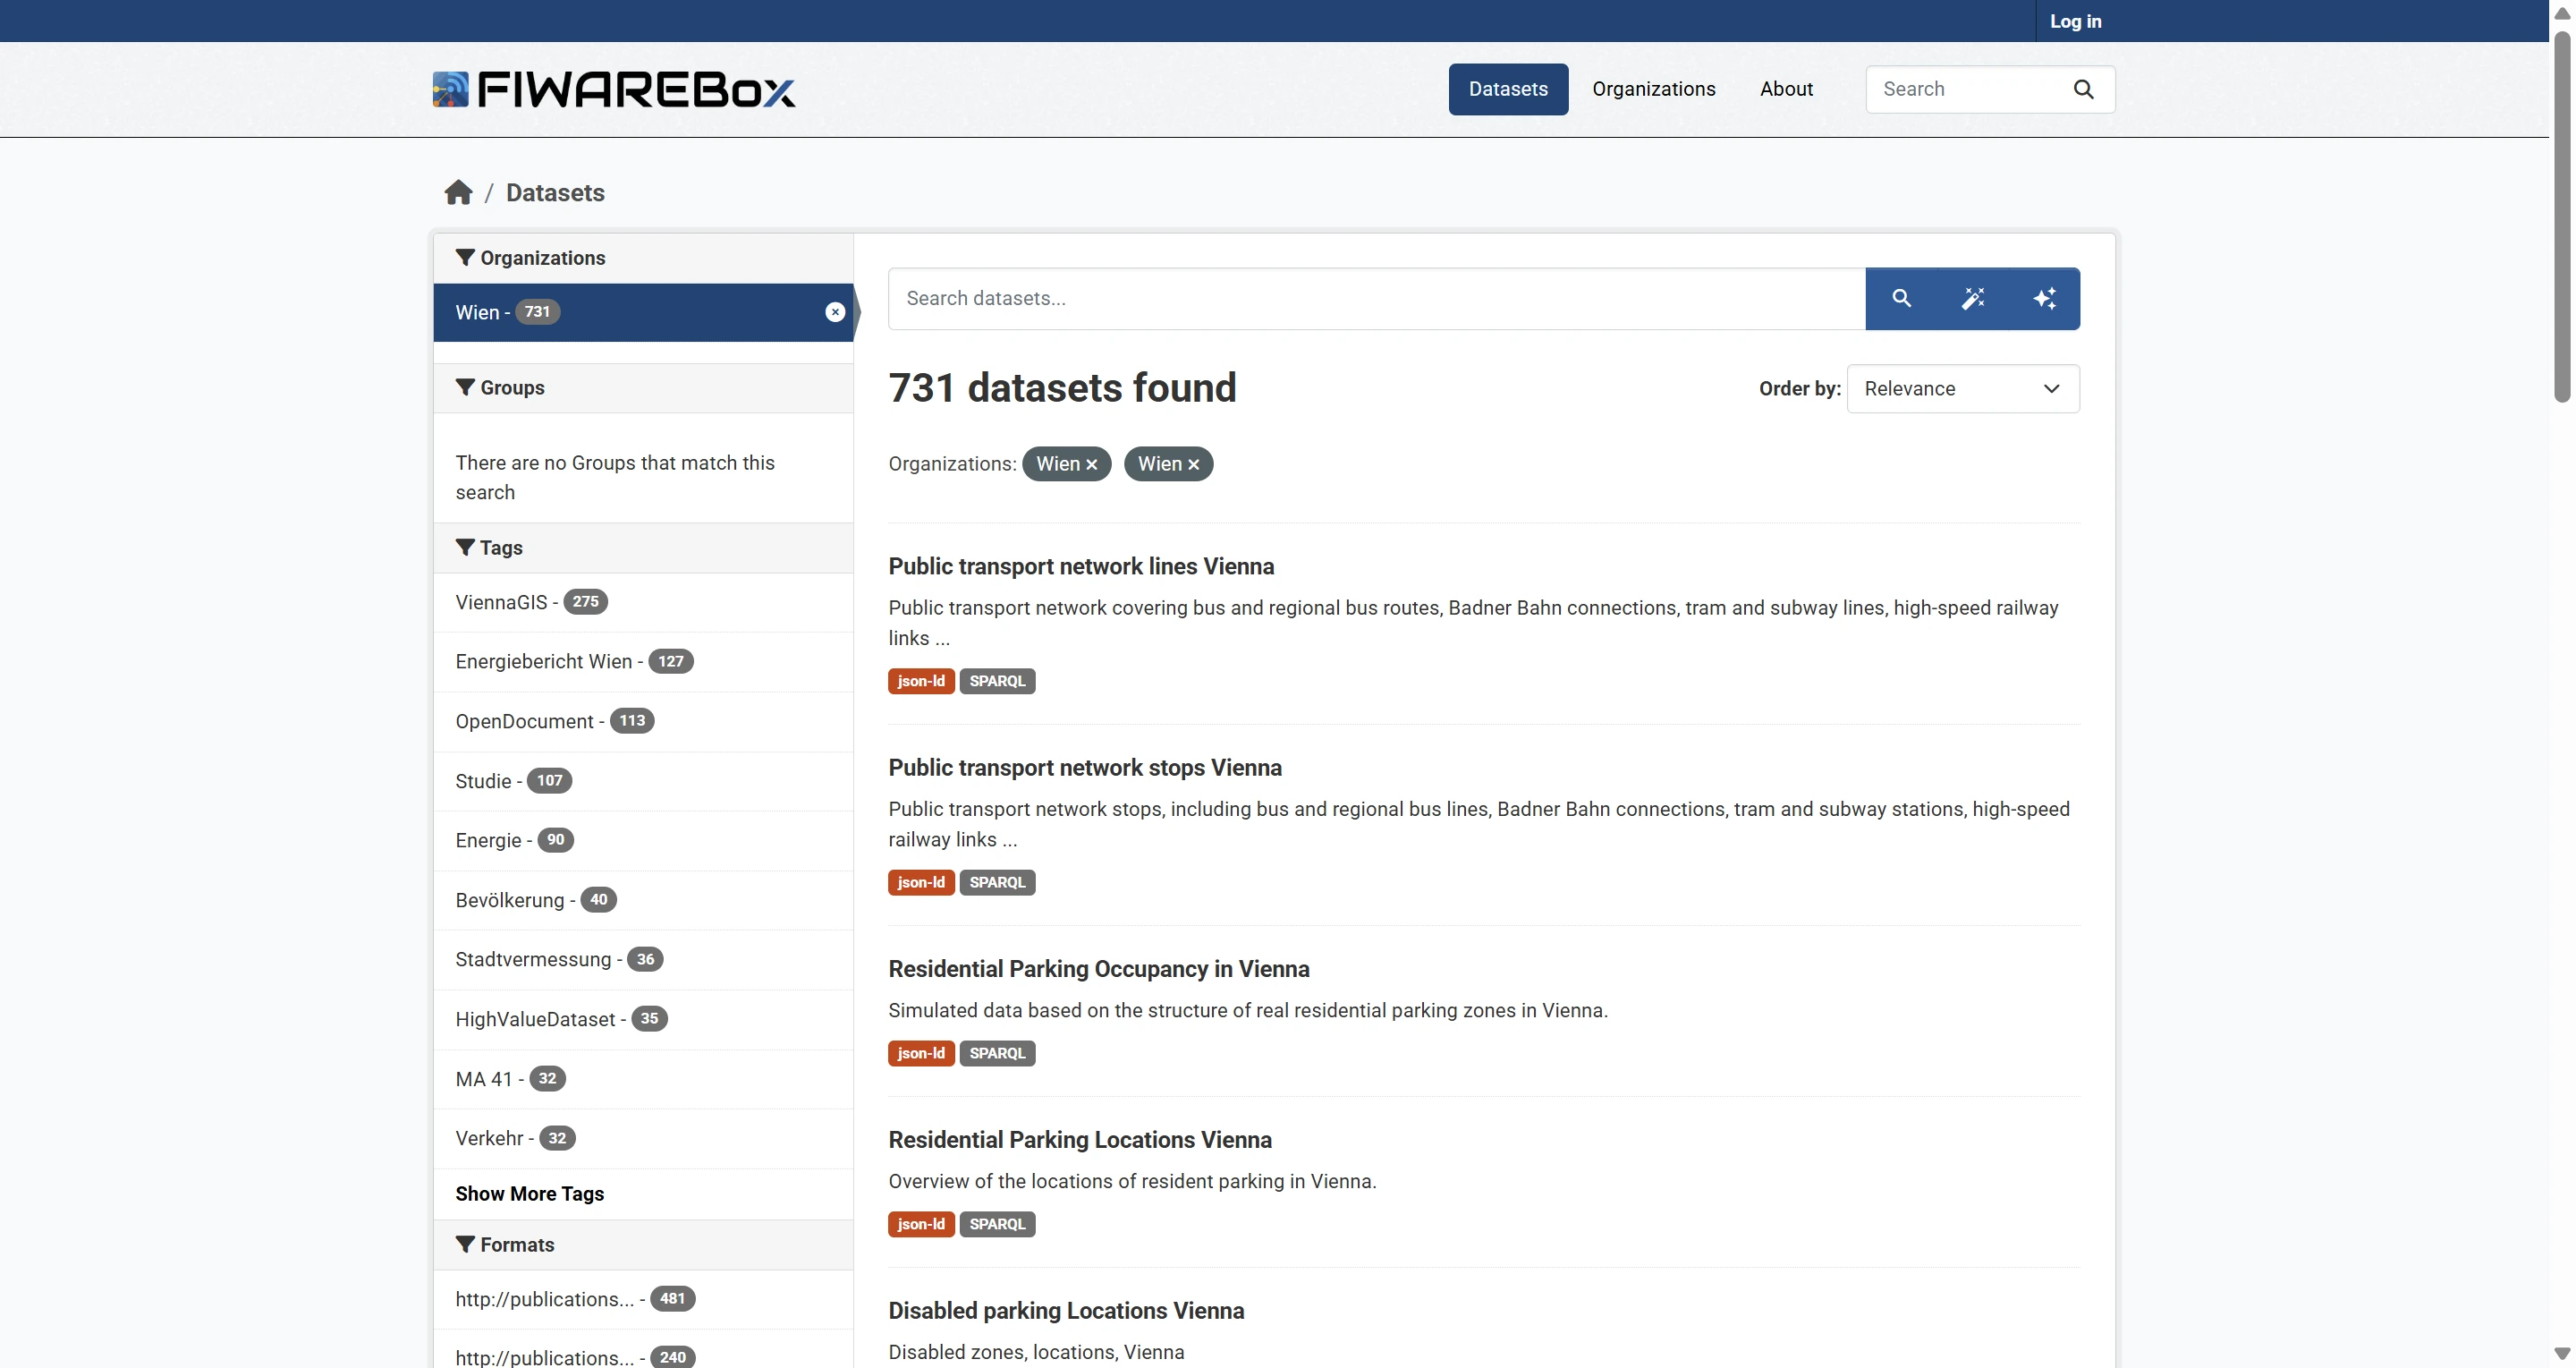
Vienna datasets in FIWAREBox,
BUILDING THE DEMO: OPEN DATA, SIMULATION, AND LIVE STREAMS
With both portals accessible, we set up the demo. The idea was simple: create a realistic cross-city scenario based on mobility. We combined open data from Vienna and Bratislava with additional simulated streams. For example, we generated synthetic vehicle data to fill the gaps where real sensors were unavailable. This is common in early-stage prototyping: the goal is to illustrate the logic, not to wait until perfect data appears.
We also included live mobility feeds from GBFS and GTFS to enrich the scenario with bike availability, public transport schedules, real-time delays, and vehicle positions. In other words, we took static archives, simulated and real streams, real-time APIs, and IoT-like inputs and placed them all into one unified processing pipeline.
GBFS AND GTFS: USEFUL, POWERFUL AND OCCASIONALLY A BIT CHAOTIC
GBFS, the bike sharing standard, is relatively lightweight. It is based on simple JSON files that describe the availability of bikes and docks, station status, and system metadata. Most operators follow the specification reasonably well, and integrating GBFS is usually straightforward. The challenge is that each operator adds its own extensions, extra fields, or unusual naming conventions. Nothing dramatic, but enough to require some normalization.
GTFS, on the other hand, is more complex. The static version describes schedules, routes, shapes, calendars, and stops. The real-time version covers delays, vehicle locations, and trip updates. GTFS is incredibly powerful and used globally, but it suffers from inconsistent interpretations. Agencies add custom fields or omit parts of the specification, which means GTFS feeds can look quite different from city to city. Merging GTFS from Vienna and Bratislava without a unified model would be extremely difficult.
The formats are not the problem; the interpretation is. A Data Space needs a layer that is above the formats, not dependent on them. This is where semantics enter the picture.
THE FICTIONAL USE CASE: VIENNA TO BRATISLAVA ON PUBLIC TRANSPORT
Now imagine a traveller who wants to go from Vienna’s city centre to a specific address in Bratislava using only public and shared mobility. Of course, it can simply use Google Maps, but for our use case, we can prepare a similar solution. To calculate such a route, one system must understand transit schedules, current delays, bike availability, mobility hubs, pedestrian connections, and points of interest in both cities. Google Maps works this way because it enforces data compliance globally.
Public transport operators benefit when they participate in such ecosystems. They reach more users, provide better travel options, reduce private car reliance, and integrate more deeply with regional mobility planning. Everyone benefits from interoperable data. On the other case, these formats / streaming options can be use for other solutions, not just public transport and e-bike sharing.
Our aim was to reproduce the basic logic of such a cross-city routing system using open data, simulation, and FIWAREBox. Not a full Google Maps replacement, but enough to show how a Data Space makes these connections natural.
WHY EVERYTHING WAS CONVERTED INTO JSON-LD
After gathering all the data sources, we converted them into JSON-LD. This step makes the structure explicit. JSON-LD allows us to attach context, define relationships, unify naming conventions, and follow NGSI-LD requirements. Once data is represented this way, our Context Broker can treat information from Piveau, CKAN, real-time GBFS and GTFS, simulations, or IoT sensors as if they all originate from the same semantic model.
Instead of separate feeds, we suddenly have a unified collection of entities that understand each other. Routes become entities. Bike stations become entities. Parking spots become entities. Everything starts speaking the same language.
WHAT SEMANTICS MEAN AND WHY WE ADD THEM TO FIWAREBOX
Semantics provide meaning. They transform data from a list of fields into a network of concepts. A bike station stops being a row in a CSV or element in a data stream and becomes an object that is located at a specific coordinate, which is near a tram stop, which is part of a route, which is operated by an agency, which is part of a regional transport network.
This shift matters because it allows data from different domains to interact. A parking dataset can be linked to mobility hubs. A weather dataset can influence trip predictions. A transit dataset can be joined with a border crossing dataset. None of this is easily possible with plain CSVs or even conventional APIs.
With semantics in place, queries also change. Instead of trying to join tables manually, you can ask:
“Which bike stations in Vienna have low availability and are near bus stops that offer frequent service?”
or
“Which mobility options exist between two addresses across two cities, considering current delays?”
or
“What parking zones correlate with shared bike demand?”
These are high-level, meaningful questions that follow relationships in the data graph, not individual files.
A simple metaphor helps: semantics are to smart city data what assembly instructions are to IKEA furniture. You can attempt to assemble it without instructions, but the result will wobble. With instructions, everything fits.
THE USE CASE: VIENNA AND BRATISLAVA PUBLIC TRANSPORT
With both data portals connected, with JSON-LD normalizing formats, with semantics linking concepts, and with the graphical query builder available, the Vienna–Bratislava mobility use case became a practical demonstration of cross-city Data Space. We modelled public transport, bike sharing, road and parking conditions, and various mobility connections. The data graph allowed us to navigate entities, combine information, and produce coherent cross-border mobility insights.
It was never intended to be a fully operational routing system, but it showed exactly how FIWAREBox and semantic interoperability create the backbone for one.
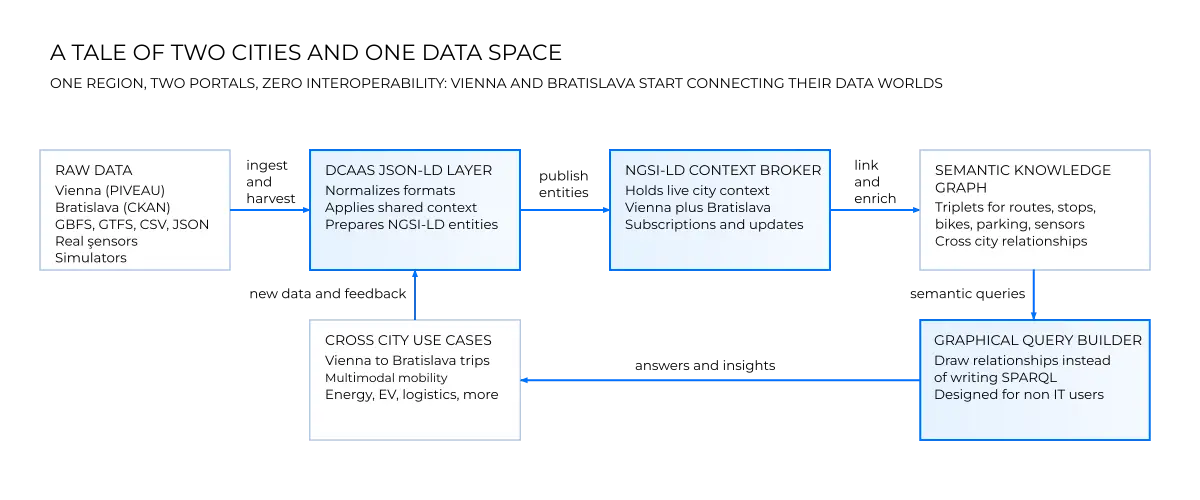
The flow from raw data to JSON-LD, through the NGSI-LD Context Broker and into the semantic graph, followed by the graphical query builder and the resulting smart use cases
A GRAPHICAL QUERY BUILDER FOR PEOPLE WHO DO NOT SPEAK SPARQL
Most people participating in Industry Meets Makers are not developers, yet they still need to explore data, test ideas, and create prototypes. Writing SPARQL by hand or constructing complex NGSI-LD queries is not realistic for them. That is exactly why we added a graphical query builder to FIWAREBox.
The tool lets users construct queries visually by drawing relationships between entities. Instead of typing a long query, they simply express their logic: a bike station connects to a stop, the stop is part of a route, the route is delayed, and this relationship is constrained by time. The query builder converts this into SPARQL or NGSI-LD automatically.
This video below demonstrates how to use the Sparnatural query builder to visually construct SPARQL queries. Using a subset of GTFS data for Vienna and Bratislava, we start by querying for all transit stops associated with routes from two specific agencies. Next, we refine the results by selecting a specific geographic zone on the map, filtering the stops to include only those within the area. Finally, by including coordinates in the output, we visualize the exact locations of the resulting stops directly on the map.
The benefit is immediate. People who never worked with semantic technologies can build advanced queries within minutes. The tool also acts as a teaching instrument because users see how their visual model translates into an actual query. Workshops become more productive, and ideas can be tested instantly.
RECAP
The Vienna–Bratislava demo is simple by design. Its purpose is not to implement every detail but to demonstrate how combining data from multiple cities becomes feasible when a Data Space approach is used.
The same principles apply far beyond mobility. Digital product passports in industry, energy management, EV charging infrastructure, logistics, environmental monitoring, public buildings, and many other verticals all benefit from these patterns.
Both GBFS and GTFS continue to be powerful yet messy standards. Each operator interprets them differently, and simple cross-city merging is almost impossible. But once everything enters the JSON-LD and semantic layer, those differences disappear. Our upcoming automatic conversion tools will standardize formats even further, creating NGSI-compliant, interoperable datasets regardless of original structure.
WHAT SHOULD WE CONNECT NEXT?
We are preparing the next use case. It could be EV charging infrastructure, parking data fusion, water and energy cross-border flows, logistics corridors, or even a full regional mobility dashboard. If you are participating in Industry Meets Makers, you will get full access to the datasets, connectors, and FIWAREBox environment.
Tell us which direction you want us to explore next.
DISAGREE, COMMENT, OR WISH TO KNOW MORE?
CKAN: EXTENDED DATA BROWSER